The Situation
LuxeWash is a mobile car detailing and ceramic coating business operating across Broward County, Florida. Mobile detailing is a crowded, low-barrier category: anyone with a van and a pressure washer competes for the same searches, and customers rarely plan ahead. They search when the car is already dirty and they book whoever answers first.
That creates three specific problems, and none of them are solved by "getting a website":
- Demand is immediate and local. Someone searching "mobile detailing near me" is not comparing vendors for a week. If you are not visible in the first screen of results or in the Google Maps pack, you were never in the running.
- Every lead has a hard ceiling. A detailing job carries a specific margin. Pay more than that to acquire the job and growth actively costs money — which is exactly how service businesses end up busy and broke.
- Winter kills you. South Florida detailing has a real seasonal floor between November and February. A business that depends only on paid ads has no cushion when demand drops.
The Strategy
The plan was deliberately unglamorous: buy demand where it is profitable, build organic assets that keep working when the ads are off, and measure precisely enough to know which is which.
Fix measurement before spending anything
Conversion tracking went in first: Google Ads conversions tied to booking confirmations, calls and WhatsApp clicks, plus GA4 key events for each. Without this, every later decision would have been a guess. Most of the accounts we take over are optimizing toward numbers that were never accurate.
Set the acquisition ceiling from the margin, not from a benchmark
We worked backwards from what a job is actually worth. With roughly three leads converting into one booked job, a target cost per acquisition of $55 lands at about $165 per job — profitable against the real margin. At $80 the same math hits break-even. Knowing where the ceiling sits is what keeps a campaign from quietly destroying value while the dashboard looks busy.
Treat each city as its own economic unit
The campaign was structured so cost per lead could be read city by city rather than as a single blended number. That blended number hides everything: profitable markets end up subsidizing markets that never convert.
Build organic assets in parallel from day one
Dedicated pages for each city served, service pages for every offering, a content cluster answering the questions customers actually search, and continuous Google Business Profile work. This is the part that compounds — and the part most businesses skip because it pays nothing in month one.
Make the site legible to AI assistants
Structured data across the site, a machine-readable summary of the business, and explicit crawler permissions for AI systems. This was speculative when we did it. It stopped being speculative when the analytics started reporting it as a distinct traffic source — see below.
What the Numbers Say
Paid search
August 2026, a single campaign across six cities:
| Metric | Result |
|---|---|
| Clicks | 282 |
| Click-through rate | 5.31% |
| Average cost per click | $5.44 |
| Impression share lost to budget | 0.06% |
| Impression share lost to rank | 54.34% |
Those last two rows are the most useful diagnostic in the whole account. Losing almost nothing to budget and more than half to rank means the constraint is not money — it is how aggressively the campaign is allowed to bid. Raising the daily budget would have changed nothing. Most advertisers reach for the budget slider first, because it is the obvious lever, and then wonder why volume did not move.
Cost per lead by city
Same campaign, same creative, same landing pages. The only variable is geography:
| City | Cost per lead | Verdict |
|---|---|---|
| Pembroke Pines | $53.87 | Scale |
| Fort Lauderdale | $60.24 | Scale |
| Hollywood | $67.67 | Keep |
| Plantation | $69.10 | Keep — highest volume |
| Weston | $88.81 | Watch |
| Davie | $92.19 | Under review |
A 71% spread between the best and worst city inside one campaign. Reported as a single blended average, all of that disappears and the account looks merely adequate.
Organic search
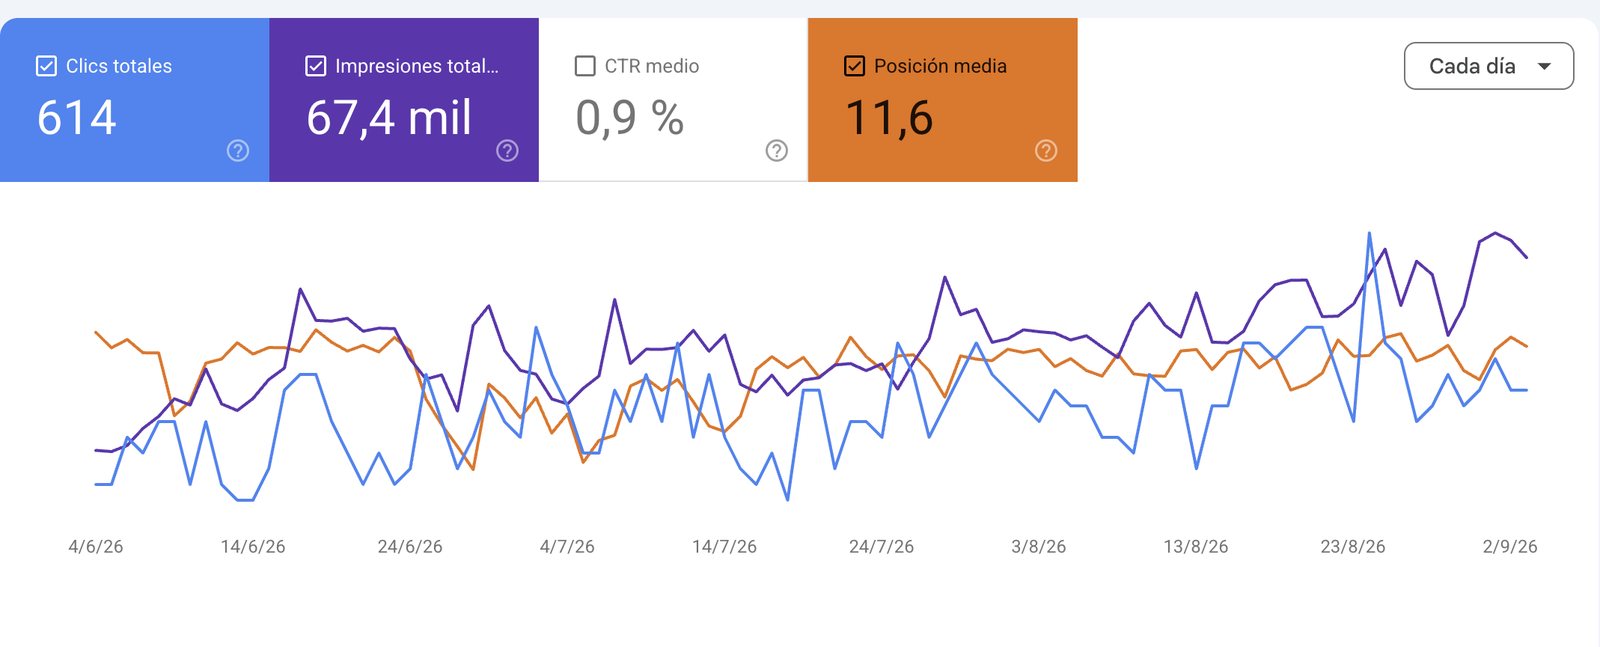
Over a 28-day window: 234 clicks, 24,200 impressions, average position 10.8, improved from 12.5 the previous month. The site now covers 82 indexed URLs, including a page for each city served and a cluster of content targeting the questions customers ask before they book.
The finding we did not expect
Traffic broken down by source over the same 28 days shows something worth paying attention to. Sessions arriving from AI assistants were a fraction of total volume — but they converted at 8.47%, the highest rate of any channel on the site, ahead of organic search, paid search and social.
The volume is still small. The conversion rate is not an accident: someone who arrives after asking an assistant for a recommendation has already been pre-qualified by the recommendation. We now build for this deliberately on every site we produce, and almost nobody is measuring it yet.